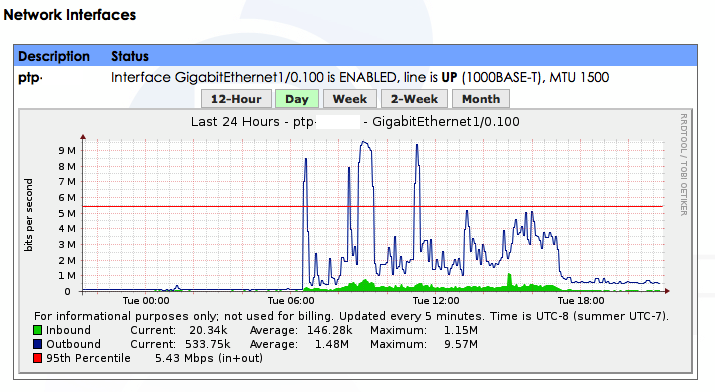
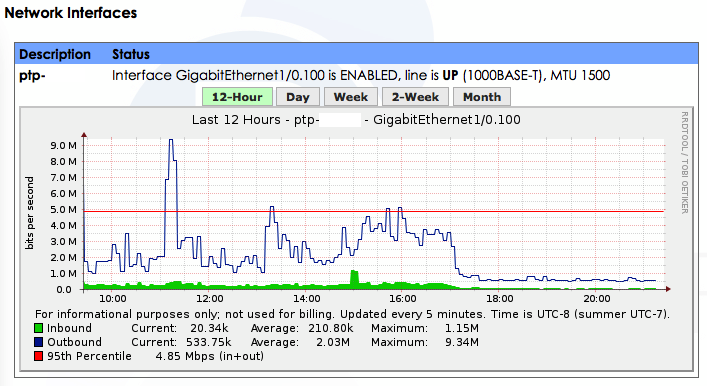
We’ve added some new graphing options for the interface traffic graphs available to our Colocation, Dedicated Server, and Internet Access customers. Previously the account control center only displayed a 24-hour live (with 15 minute delay) graph; interface graphs are now available with as little as a 5 minute delay from live traffic and with several viewing options from 12-hours to a month.


We’ve also added a 95th percentile line on all traffic graphs, however it’s based on the currently displayed interval, not the full billing month. As such these graphs are not used for burstable billing.
